About
Microservice application developed with NestJs and deployed on kubernetes
Prerequisite and Tool
- Nestjs
- Flutter
- Azure account
- Kubernetes
- Terraform
- Helm
- Prometheus
- Grafana
- ArgoCD
- OpenTelemetry
Overview (DEV)
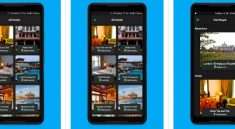
Koultime is a mobile application that helps find your best food and order it online.
.gif)
Frontend:
- Mobile application developed with flutter
Backend:
- Microservice application developed with Nest.js
The reosons behind choosing the microservice architecture is:
- The flexibility to add new services
- The ability to scale the service of orders independtly whenever we have a lot of demand
Services :
-
Orders Microservice:
- Create orders
- Get list of orders
-
Product Microservice
- Get list of products
- Create new product
-
The microservices communicate with an api gateway
Architecture
Overview (OPS)
Deployment
-
The client could only communicate with the api gateway: we should expose a public IP
-
For the microservices we should allow only the traffic from the api gateway
-
The different apps are isolated in their namespaces (which we give the possibility of having multi env)
-
The connection to the database is made through the connection string (provided by mongodb atlas) and stored in a secret
-
I used config maps to store the name of the services that will be used by the api gateway to send requets to microservices
Workload health tracking
/health is the route responsible of returning the pod’s health implemneted using terminus package.
livenessprobe is added to the deloyment definition in order to track the health based on the response of /health
Helm
I created helm charts with values file for every microservice.
Check the charts Here
I used the charts of prometheus and grafana for monitoring.
Automation
The provisioning of the cluster is made by the first stack of Terraform
The provisioning of the helm release of argocd is made by the second stack of Terraform
The deployment is automated using argoCD
Network visualization of the api-gateway
Tree of the api-gateway
Tree of the order microservice
Monitoring
Metrics
-
The different metrics are set using prometheus:
- cpu usage, memory usage, number of requests..
-
A bussiness metric is called orders is the one responsible for counting the number of orders requested
We can vizualize the diferent metrics using Grafana:
Logs
Used Nest.js logger to collect logs.
Test the project
Make sure that you have all the tools installed
- Clone the project
- Under the script folder you will find scripts
- execute init_tf.bash
- connect to the cluster
- execute init_helm.bash